The Confident Math Behind Your GPS That's Almost Always a Little Bit Wrong
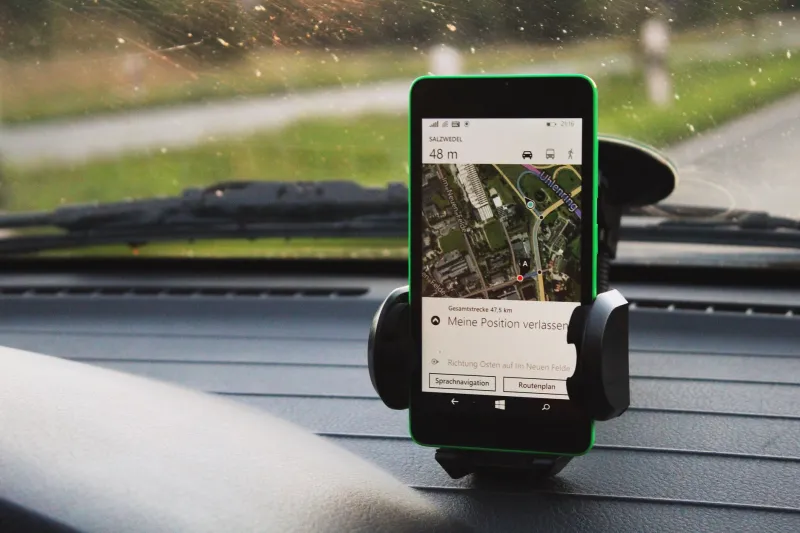
You've been there. You punch your destination into Google Maps or Waze, and the app declares, with zero hesitation, that you'll arrive in 23 minutes. You pull out of the driveway. By the time you reach the end of your street, it's 26 minutes. Merge onto the interstate and suddenly it's 31. You haven't made a wrong turn. Nothing unusual has happened. The app just… changed its mind.
So what's actually going on under the hood? Turns out, the math powering that arrival estimate is both incredibly sophisticated and fundamentally uncertain — and understanding the gap between those two things tells you a lot about how algorithms shape everyday decisions.
It Starts With a Speed-Distance Problem (And Gets Complicated Fast)
At its most basic level, ETA prediction is a classic math problem: time equals distance divided by speed. If you're driving 15 miles and averaging 60 mph, you'll arrive in 15 minutes. Elementary school stuff.
But real roads aren't a math worksheet. Speed changes constantly. There are traffic lights, merge lanes, school zones, accident rubbernecking, and that one guy who brakes for no apparent reason. So navigation systems don't just calculate one big average speed — they break your route into segments and assign a predicted speed to each one.
Those predicted speeds come from a combination of sources: historical traffic data (how fast does traffic typically move on this stretch of I-95 on a Tuesday at 5:47 PM?), real-time sensor data from connected vehicles, and reported incidents from other users. Stack all those together, run them through a model, and you get a predicted travel time for each segment. Add them up, and you get your ETA.
Simple in theory. Wildly complicated in practice.
Historical Data Is the Secret Ingredient — And Its Biggest Weakness
Here's where it gets mathematically interesting. The backbone of most ETA prediction models is historical pattern matching. These systems have ingested years' worth of GPS data from millions of drivers. They know that the merge onto I-285 in Atlanta slows down by an average of 40% between 5:15 and 6:30 PM on weekdays. They know that the stretch of the 405 near LAX gets worse on Friday afternoons when flights land.
That historical data is genuinely powerful. It's the reason your app often nails the ETA when conditions are typical — because it's essentially calculating a weighted average of what happened to thousands of other drivers in the same situation.
But historical data has a fatal flaw: it only knows the past. The algorithm assumes tomorrow will look like a statistically averaged version of all the yesterdays it has seen. And most of the time, that's a reasonable assumption. Until it isn't.
A water main breaks on your usual route. A concert lets out early. A semi jackknifes at mile marker 44. These are called non-recurrent congestion events, and they're responsible for roughly half of all traffic delays in the US, according to transportation research. Historical models are essentially blind to them until they're already happening — and even then, the system needs time to gather enough real-time signal to update its predictions accurately.
Enter Machine Learning: Smarter, But Still Guessing
Modern navigation systems have layered machine learning on top of traditional statistical models to help with exactly this problem. Instead of relying purely on historical averages, ML models can recognize patterns in how congestion spreads — if there's a slowdown at Point A, what's the probability that Point B, three miles ahead, will back up in the next eight minutes?
These models are trained on enormous datasets and can pick up on subtle correlations that a simple average would miss. They're also better at updating in real time, continuously re-weighting predictions as new data flows in from drivers on the road.
But here's the math reality check: machine learning models are still probability machines. They output a most likely estimate, not a guaranteed one. When your app says 23 minutes, what it's really saying is something closer to: "Based on current data, our model's median prediction is 23 minutes, with meaningful probability mass spread across a range of maybe 18 to 35 minutes depending on conditions we can't fully observe."
The app just doesn't tell you that. It rounds to the nearest minute and presents the number like it's a fact.
Why Algorithms Sound More Confident Than They Are
This is the part that should genuinely interest anyone who works with numbers. Prediction models almost always have what statisticians call confidence intervals — a range of values that captures the uncertainty around any estimate. A well-built ETA model might know internally that there's a 90% chance you'll arrive between 19 and 28 minutes from now.
But user interfaces almost never show you that range. They show you one number, because one number is cleaner, easier to act on, and frankly what most people want to see. The uncertainty gets hidden in the design.
This isn't unique to GPS. Weather apps do it. Financial forecasts do it. Medical risk calculators do it. The underlying math is probabilistic, but the presentation is often falsely precise. It's a tension between mathematical honesty and usability — and usability usually wins.
For students learning statistics, this is a genuinely important real-world lesson: the difference between a point estimate and a confidence interval isn't just a textbook concept. It's the gap between what an algorithm actually knows and what it chooses to tell you.
What Happens When the Model Gets Humbled
The clearest examples of ETA prediction failure tend to cluster around extreme or unusual events. During major snowstorms, navigation apps have famously routed drivers into multi-hour standstills because the historical data for "blizzard conditions on this highway" was too sparse to inform a reliable model. During the early months of COVID lockdowns in 2020, traffic prediction models built on years of commuter data became nearly useless overnight — the input patterns had simply never existed before.
These aren't failures of bad engineering. They're illustrations of a mathematical truth: models can only extrapolate from what they've seen. When reality steps outside the training distribution, even sophisticated algorithms can get it badly wrong — confidently.
The Takeaway for Your Math Brain
Next time your GPS quietly bumps your arrival time by four minutes, don't just be mildly annoyed. Take a second to appreciate what's actually happening. A system is running continuous probabilistic updates, integrating real-time data with historical models, trying to minimize prediction error across millions of simultaneous route calculations.
And it's still kind of guessing.
That's not a knock on the technology — it's genuinely impressive math. But it's a useful reminder that confidence in a number and accuracy of a number are two totally different things. Whether you're reading an ETA, a poll result, or a stock forecast, the question isn't just what does it say — it's what does the model actually know, and how much uncertainty is hiding behind that clean-looking figure?
That's the kind of mathematical thinking that turns a navigation app into a lesson in statistics. And honestly? That's pretty much what MathBin is here for.